Home
Chapter 3: Mechanical Properties of Materials
M3.1: The Tension Test
Unload/Reload Behavior
State the Problem
Table of Contents
Tension Test Setup
Measurements
Conducting the Test
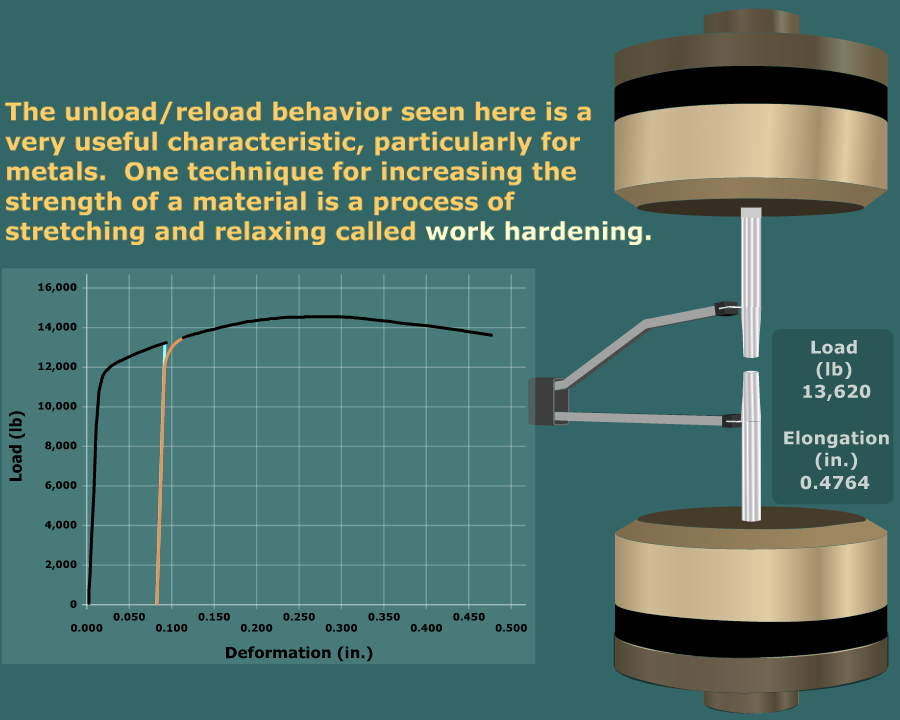
Unload/Reload Behavior
Stress-Strain Curve From Load-Deformation Curve
scene
6
of
7