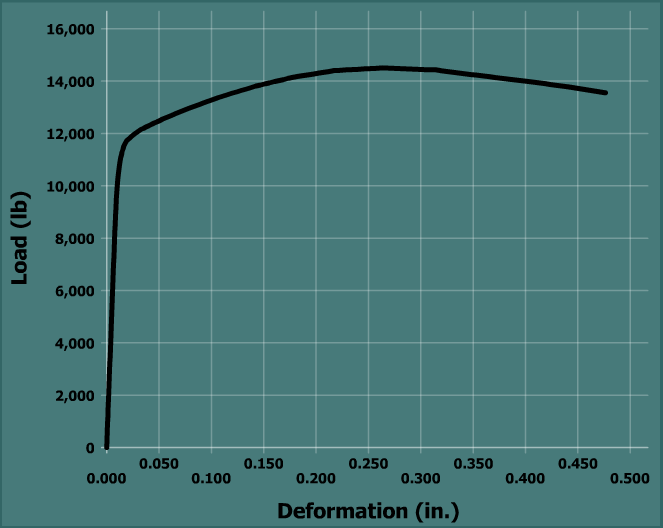
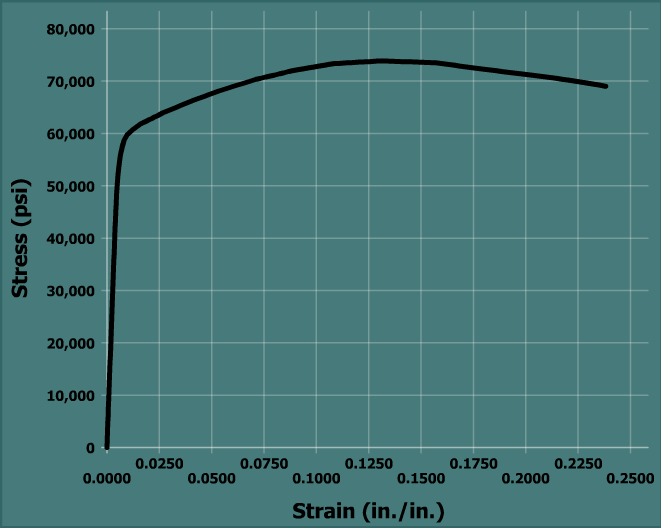
The load-deformation plot and the corresponding stress-strain diagram are shown below. Material properties that are essential for engineering design are obtained from the stress-strain diagram. In the following scenes, the stress-strain diagram will be examined to determine the proportional limit, the elastic modulus, the yield strength, and the ultimate strength. The difference between engineering stress and true stress will also be discussed.

The graph plots the load in pounds versus the deformation in inches. The vertical axis ranges from 0 to 16,000 pounds and the horizontal axis ranges from 0 to 0.5 inches. The graph starts from the bottom left at the origin, goes up and to the right with very high steepness till the point (0.025, 12,000). The graph then goes up and to the right with constant steepness till (0.25, 14,200). The graph then goes down and to the right with approximately constant steepness till (0.4764, 13,620). All values estimated.
The graph plots stress in p s i versus the strain in inch per inch. The vertical axis ranges from 0 to 80,000 p s i and the horizontal axis ranges from 0 to 0.25. The graph starts from the bottom left of the viewing window at the origin, goes up and to the right with very high steepness till the point (0.01, 60,000). The graph then goes up and to the right with constant steepness till (0.125, 74,000). The graph then goes down and to the right with approximately constant steepness till (0.24, 68,000). All values estimated.