The graph plots stress in p s i versus strain in inch per inch. The vertical axis ranges from 0 to 80,000 and the horizontal axis ranges from 0 to 0.25. The graph starts at the origin, shoots vertically up to the point (0, 46,000) on the vertical axis, goes horizontally to the right till (0.05, 46,000), goes up and to the right with approximately constant steepness till (0.2, 67,000), goes up and to the right with decreasing steepness till (0.225, 69,000), goes down and to the right till (0.25, 67,000) and ends. The portion of the graph between the vertical axis and the point (0.05, 46,000) is labeled yielding.

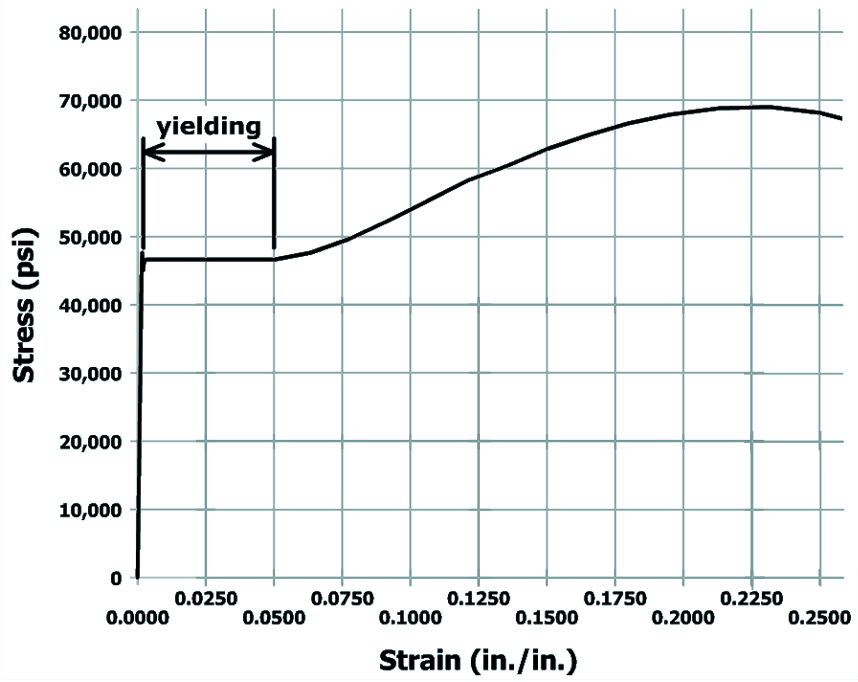
For many common materials, such as the low-carbon steel shown here, the elastic limit is indistinguishable from the proportional limit. Past the elastic limit, relatively large deformations will occur for small or almost negligible increases in stress. This behavior is termed yielding.