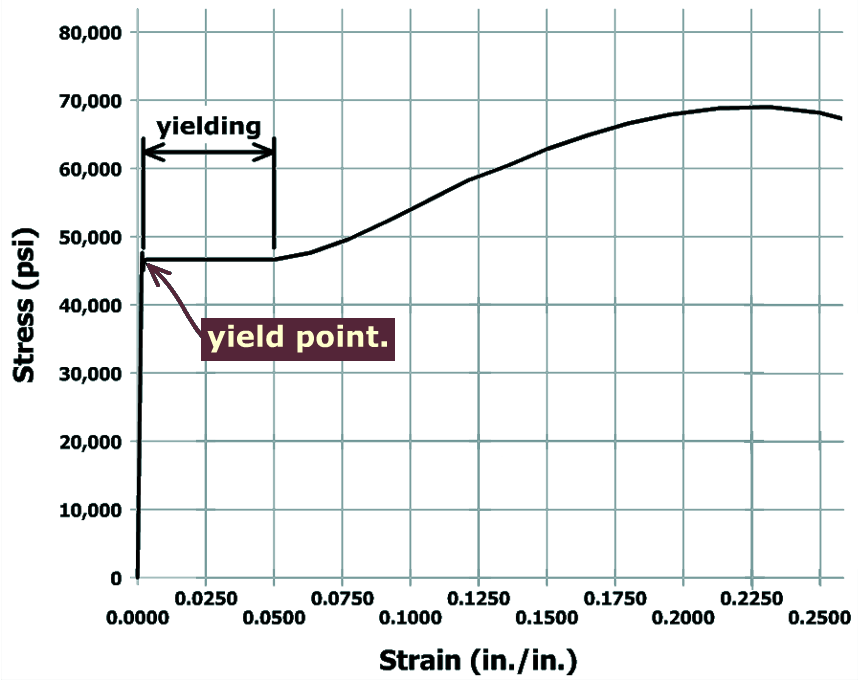
A material that behaves in the manner depicted here is said to have a yield point. The yield point is the stress at which there is an appreciable increase in strain with no increase in stress.
Not every material has a yield point.
A material that behaves in the manner depicted here is said to have a yield point. The yield point is the stress at which there is an appreciable increase in strain with no increase in stress.
Not every material has a yield point.