The graph plots stress versus strain. The curve starts at the bottom left of the viewing window at the origin, goes up and to the right with a constant steepness and then goes slightly to the right. The curve then goes up and to the right with increasing steepness, reaches a maximum and then goes down and to the right with increasing steepness and ends at the top right of the viewing window.

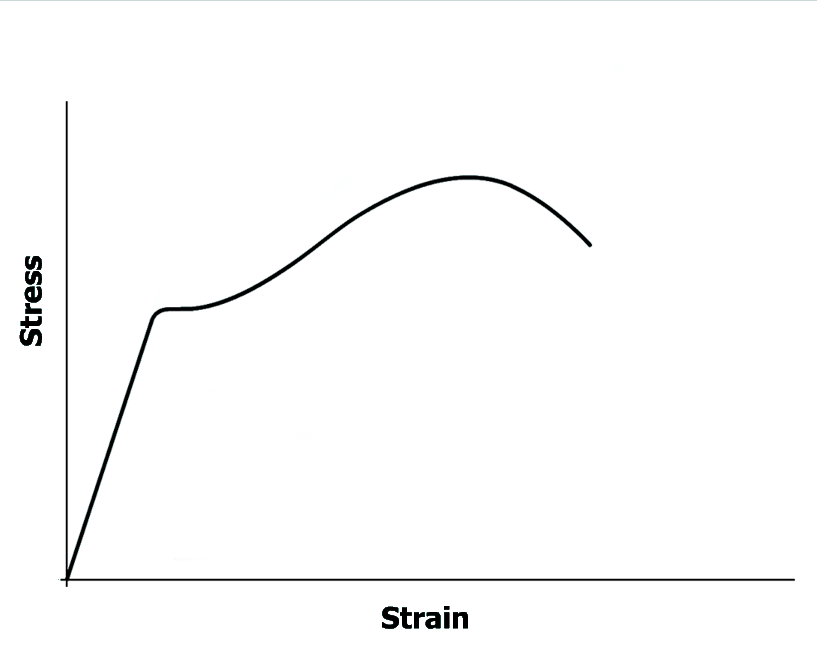
The stress-strain diagram provides essential engineering design information that is applicable to components of any shape or size. While each material has its particular characteristics, several important features are found on stress-strain diagrams for materials commonly used in engineering applications.