Home
Chapter 3: Mechanical Properties of Materials
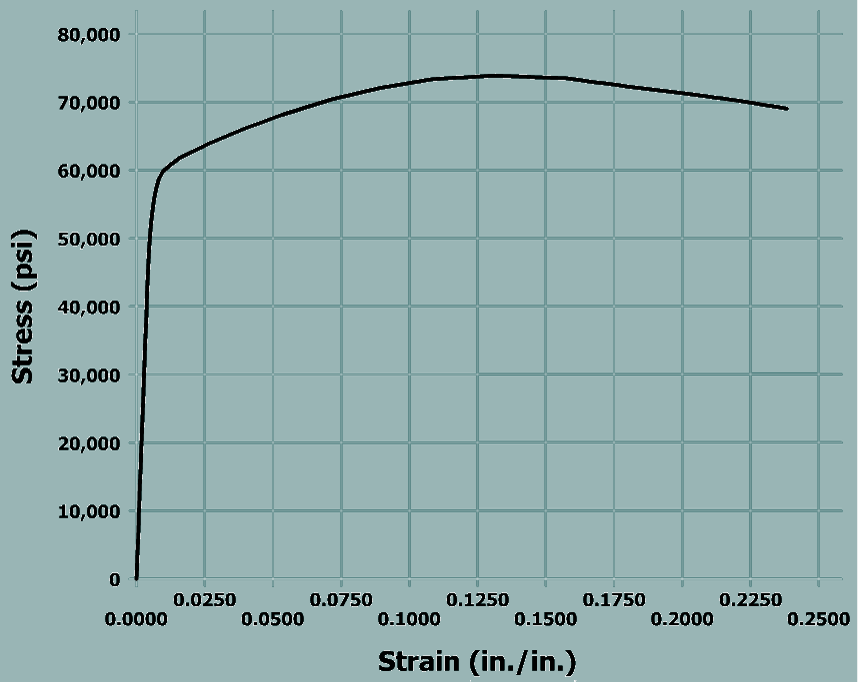
M3.2: The Stress-strain Diagram
Proportional Limit
Introduction To the Stress-Strain Diagram
Table of Contents
Proportional Limit
Elastic Modulus
Elastic and Inelastic Strain
Elastic Limit
Yield Strength
Ultimate Strength and Fracture
Measures of Ductility
Review of Significant Features
scene
3
of
10
We will initially focus our attention on the straight-line portion of the stress-strain curve.