The graph plots stress in p s i versus the strain in inch per inch. The vertical axis ranges from 0 to 80,000 p s i and the horizontal axis ranges from 0 to 0.25. The graph starts from the bottom left of the viewing window at the origin, goes up and to the right with very high steepness till the point (0.01, 60,000). The graph then goes up and to the right with constant steepness till (0.125, 74,000). The graph then goes down and to the right with approximately constant steepness till (0.24, 68,000). All values estimated.

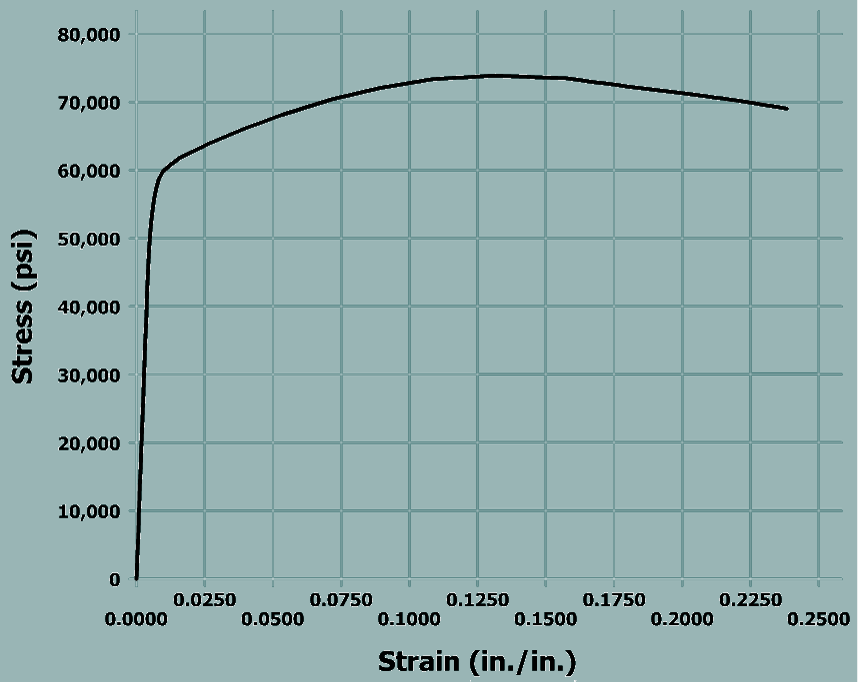
The proportional limit is the stress at which the stress-strain plot is no longer linear.

Looking at this plot, the proportional limit seems to occur around 53,000 psi. However, it is difficult to say with confidence at this scale.

We need to focus more closely on the initial linear region.