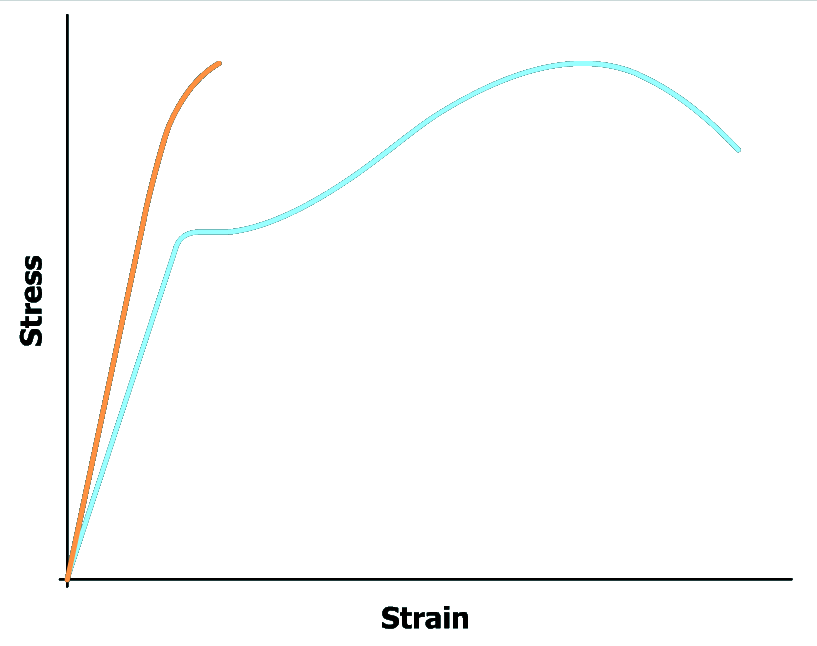
The graph plots stress versus strain. Two curves are shown. The first curve starts at the bottom left of the viewing window at the origin, goes up and to the right with constant steepness and exits the top left of the viewing window. The second curve starts at the bottom left of the viewing window at the origin, goes up and to the right with a constant steepness and then goes slightly to the right. The curve then goes up and to the right with increasing steepness, reaches a maximum and then goes down and to the right with increasing steepness and ends at the top right of the viewing window.

Strength and stiffness are not the only properties of interest to a design engineer. Another important property is ductility. Ductility describes the material's capacity for plastic deformation.