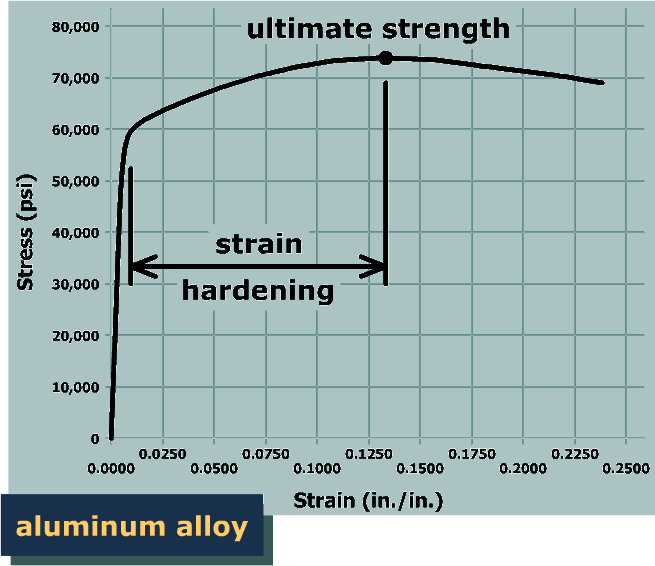
After yielding has taken place, most materials can withstand additional stress. The stress-strain curve rises continuously toward a peak stress value, which is termed the ultimate strength. The ultimate strength may also be called the tensile strength or the ultimate tensile strength (UTS). The rise in the curve is called strain hardening. The strain hardening regions for a low-carbon steel and an aluminum alloy are indicated on the stress-strain diagrams below.

The graph plots stress in p s i versus strain in inch per inch for low carbon steel. The vertical axis ranges from 0 to 80,000 and the horizontal axis ranges from 0 to 0.3. The graph starts at the origin, shoots vertically up to the point (0, 47,000) on the vertical axis, goes horizontally to the right till (0.05, 47,000), goes up and to the right with approximately constant steepness till (0.21, 69,000), reaches at maximum at (0.23, 70,000) which is marked ultimate strength, goes down and to the right till (0.3, 60,000) and ends. The portion of the graph between the points (0.05, 47,000) and (0.23, 70,000) is labeled strain hardening.
The graph plots stress in p s i versus the strain in inch per inch for aluminum alloy. The vertical axis ranges from 0 to 80,000 p s i and the horizontal axis ranges from 0 to 0.25. The graph starts from the bottom left of the viewing window at the origin, goes up and to the right with very high steepness till the point (0.01, 60,000). The graph then goes up and to the right with constant steepness till (0.13, 74,000) which is marked ultimate strength. The graph then goes down and to the right with approximately constant steepness till (0.24, 68,000) and ends. The portion of the graph between (0.01, 60,000) and (0.13, 74,000) is labeled strain hardening.