The graph plots stress in p s i versus strain in inch per inch. The horizontal axis ranges from 0 to 0.1 and the vertical axis ranges from 0 to 80,000. The graph starts at the bottom left of the viewing window at the origin, goes up and to the right with constant steepness till the point (0.050, 50,000). The graph then goes up and to the right with a reduced positive slope till (0.1, 60,000). A straight line is drawn passing through (0, 0) and (0.0040, 43,700) and it overlaps the linear portion of the curve. The triangular region below the line joining the points (0, 0) and (0.0040, 43,700) is shaded and a caption pointing to it reads: This is the elastic region for the material. The graph plots stress in p s i versus strain in inch per inch. The horizontal axis ranges from 0 to 0.1 and the vertical axis ranges from 0 to 80,000. The graph starts at the bottom left of the viewing window at the origin, goes up and to the right with constant steepness till the point (0.050, 50,000). The graph then goes up and to the right with a reduced positive slope till (0.1, 60,000). A straight line is drawn passing through (0, 0) and (0.0040, 43,700) and it overlaps the linear portion of the curve. The triangular region below the line joining the points (0, 0) and (0.0040, 43,700) is shaded and a caption pointing to it reads: This is the elastic region for the material.

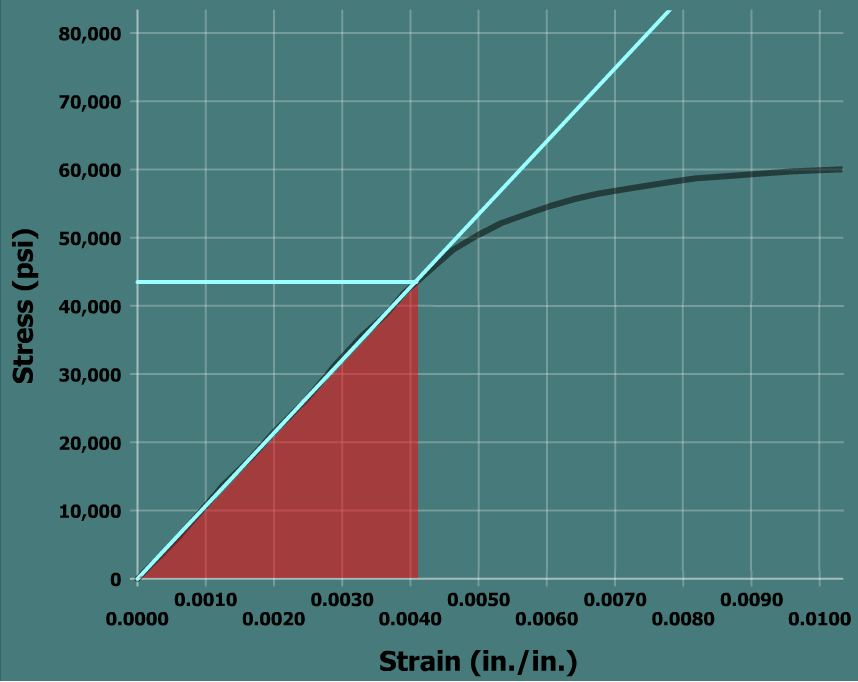
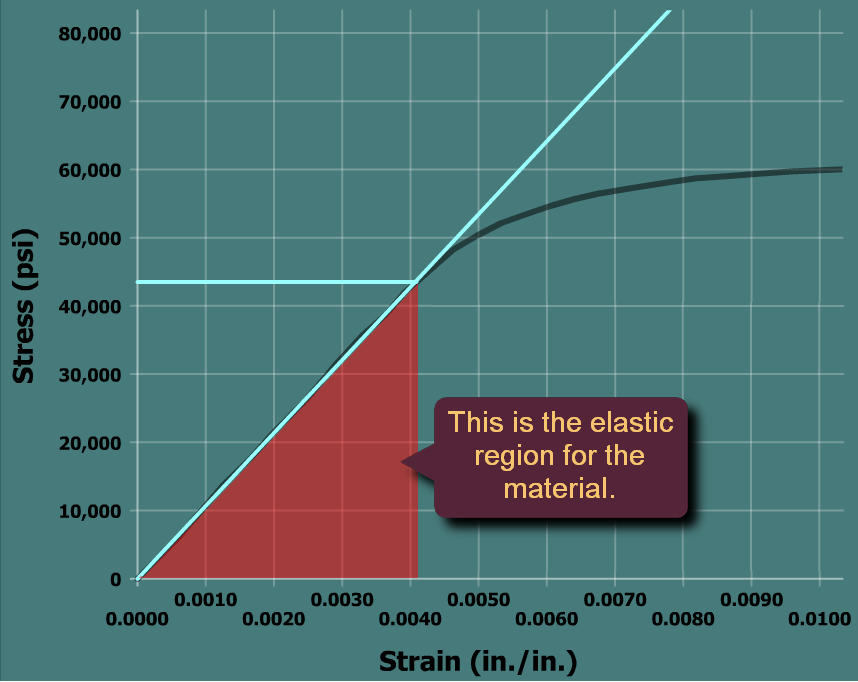
This property is called elasticity. It means that a material returns to its original dimensions during unloading. The material itself is said to be elastic in this region.

While the stress-strain curve for this material is linear, a material can be elastic even though its stress-strain curve is nonlinear.