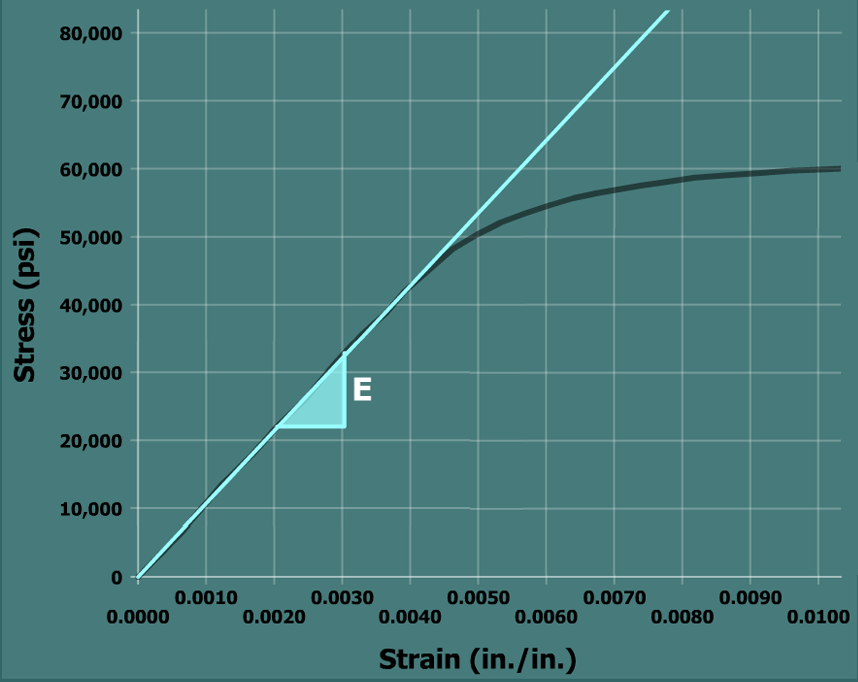
In practice, the best value for the elastic modulus is obtained from a least-squares fit of a line to the data between the origin and the proportional limit point. Using a least-squares analysis, the elastic modulus for this material is .
In practice, the best value for the elastic modulus is obtained from a least-squares fit of a line to the data between the origin and the proportional limit point. Using a least-squares analysis, the elastic modulus for this material is .