The graph plots stress versus strain. Four curves are shown. The curve labeled A starts at the bottom left of the viewing window at the origin, goes up and to the right with constant steepness and exits the top left of the viewing window. The curve labeled B starts at the bottom left of the viewing window at the origin, goes up and to the right along curve A and then goes up and to the right with decreasing steepness and exits the top of the viewing window slightly to the right of curve A. The curve labeled C starts at the bottom left of the viewing window at the origin, goes up and to the right with constant steepness along curve A, goes up and to the right with decreasing steepness, reaches a maximum and then goes down and to the right with increasing steepness and exits the center of the viewing window. The curve labeled D starts at the bottom left of the viewing window at the origin, goes up and to the right with constant steepness, goes horizontally to the right, goes up and to the right with decreasing steepness, reaches a maximum and then goes down and to the right with increasing steepness and exits the right of the viewing window. Vertical dashed lines are drawn from the end points of the curves to the horizontal axis. The vertical dashed lines from left to right correspond to curves A, B, C and D. The slope of the linear portion of the curves is marked E.

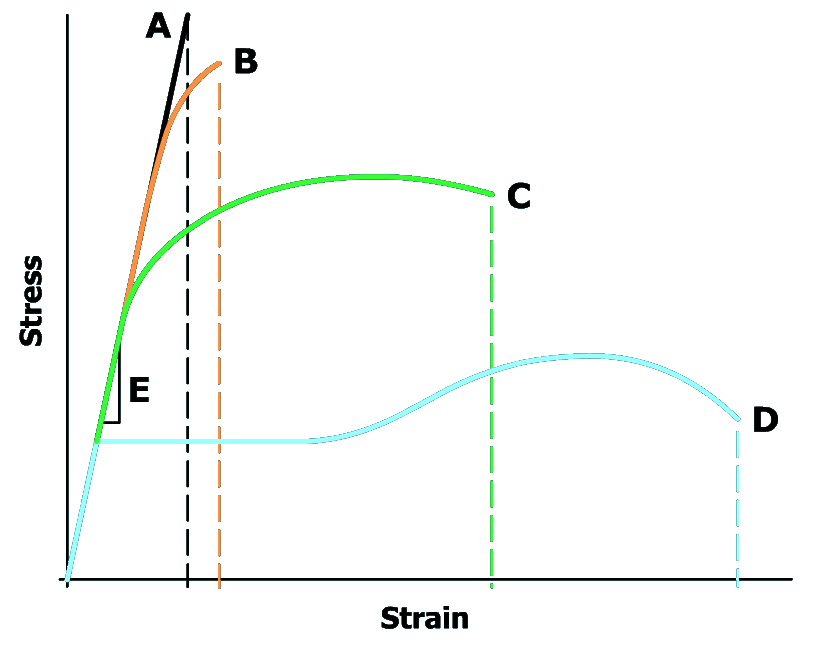
Often, there is a trade-off between strength and ductility. In this figure, stress-strain curves for four different types of steel are compared. All four curves branch from the same elastic modulus line; therefore, each of the steels has the same stiffness.

The steels range from a brittle steel (A) to a ductile steel (D).

Steel A represents is a hard tool steel, which exhibits no plastic deformation before fracture.

Steel D is typical of a low-carbon steel, which exhibits extensive plastic deformation before fracture.