The graph plots stress in p s i versus strain in inch per inch. The horizontal axis ranges from 0 to 0.1 and the vertical axis ranges from 0 to 80,000. The graph starts at the bottom left of the viewing window at the origin, goes up and to the right with constant steepness till the point (0.050, 50,000). The graph then goes up and to the right with a reduced positive slope till (0.1, 60,000). A straight line is drawn passing through (0, 0) and (0.0040, 43,700) and it overlaps the linear portion of the curve. The slope of the line has a run length delta epsilon and a rise length delta sigma.

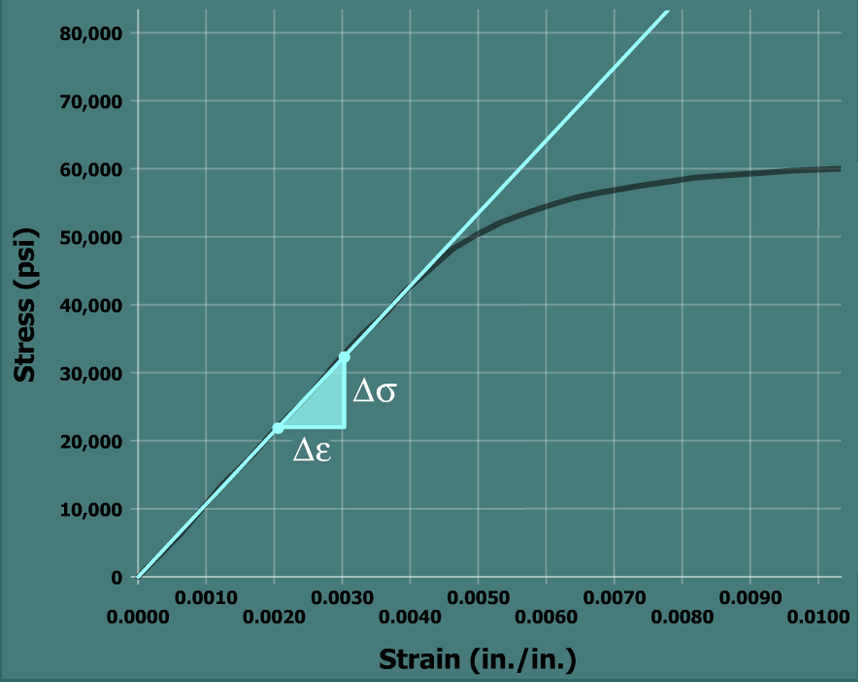
The slope is termed the elastic modulus or the modulus of elasticity and denoted by the symbol E. The slope is computed from:

E=σε

The elastic modulus is a measure of stiffness. Unlike strength measures that are used to predict how much load a component can withstand, the elastic modulus is important because it defines how much stretching, compressing, bending, or deflecting will occur in a component in response to the loads acting on it.