The graph plots stress in p s i versus strain in inch per inch. The horizontal axis ranges from 0 to 0.1 and the vertical axis ranges from 0 to 80,000. The graph starts at the bottom left of the viewing window at the origin, goes up and to the right with constant steepness till the point (0.050, 50,000). The graph then goes up and to the right with a reduced positive slope till (0.1, 60,000). A straight line is drawn passing through (0, 0) and (0.0040, 43,700) and it overlaps the linear portion of the curve. The slope of the line has a run length delta epsilon which equals 0.0010 inch per inch and a rise length delta sigma which equals 11,000 p s i.

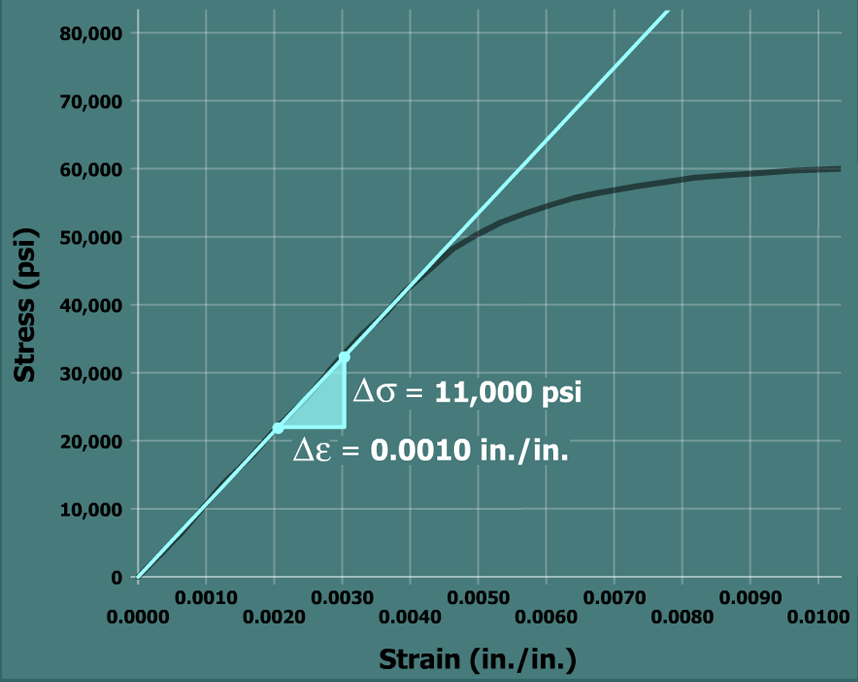
Using these two points, the elastic modulus E would be computed as:

E=σε=11,000 psi0.0010 in./in.=11,000,000 psi