The graph plots stress in p s i versus strain in inch per inch. The horizontal axis ranges from 0 to 0.1 and the vertical axis ranges from 0 to 80,000. The graph starts at the bottom left of the viewing window at the origin, goes up and to the right with constant steepness till the point (0.050, 50,000). The graph then goes up and to the right with a reduced positive slope till (0.1, 60,000). A straight line is drawn passing through (0, 0) and (0.0040, 43,700) and it overlaps the linear portion of the curve. The triangular region below the line joining the points (0, 0) and (0.0040, 43,700) is shaded. The shaded triangular region has a run length of delta epsilon which equals 0.0041 inch per inch and a rise length of delta sigma which equals 43,700 p s i.

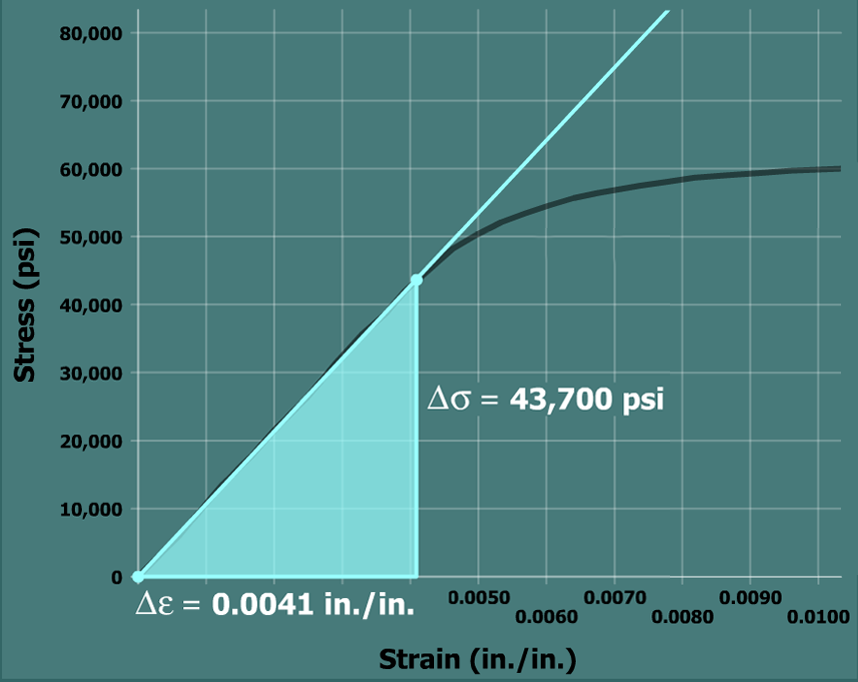
In any experimental procedure, there is some amount of error associated with making a measurement. To minimize the effect of this measurement error on the computed elastic modulus value, it is better to use widely separated points to calculate the slope.

In the linear portion of the stress-strain diagram, the two most widely spaced data points are the proportional limit point and the origin.