The graph plots stress in p s i versus strain in inch per inch. The horizontal axis ranges from 0 to 0.1 and the vertical axis ranges from 0 to 80,000. The graph starts at the bottom left of the viewing window at the origin, goes up and to the right with constant steepness till the point (0.050, 50,000). The graph then goes up and to the right with a reduced positive slope till (0.1, 60,000). A straight line is drawn passing through (0, 0) and (0.0040, 43,700) and it overlaps the linear portion of the curve. The portion of the curve between (0, 0) and (0.086, 59,000) is highlighted. Points A and B are marked on the curve at (0.04, 43,700) and (0.086, 59,000). Point C on the graph is at (0.033, 0) and a straight line is drawn joining the points B and C. The portion of the curve between the origin and point A is labeled elastic strain and the portion of the curve between the points A and B is labeled inelastic strain. The interval from the origin O to the point C is on the horizontal axis is labeled residual strain and the interval from point C to the point (0.086, 0) on the horizontal axis is labeled elastic recovery.

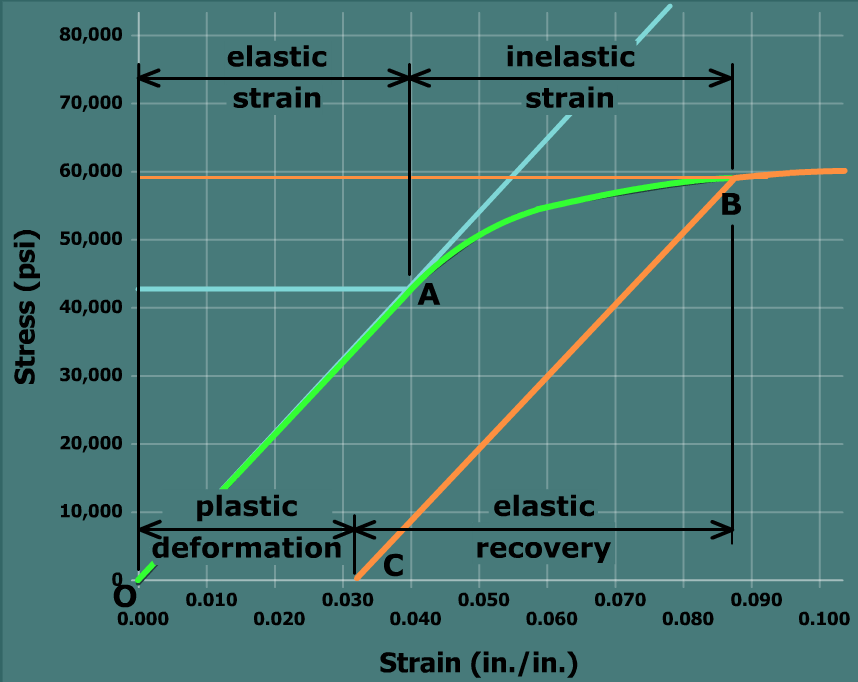
The proportional limit after reloading is now the stress at point B, which is greater than that for the original loading (i.e., point A). This phenomenon is called work hardening.