The graph plots stress in p s i versus strain in inch per inch. The horizontal axis ranges from 0 to 0.1 and the vertical axis ranges from 0 to 80,000. The graph starts at the bottom left of the viewing window at the origin, goes up and to the right with constant steepness till the point (0.050, 50,000). The graph then goes up and to the right with a reduced positive slope till (0.1, 60,000). A straight line is drawn passing through (0, 0) and (0.0040, 43,700) and it overlaps the linear portion of the curve. The portion of the curve between (0, 0) and (0.086, 59,000) is highlighted. Points A and B are marked on the curve at (0.04, 43,700) and (0.086, 59,000). Point C on the graph is at (0.033, 0) and a straight line is drawn joining the points B and C. The portion of the curve between the origin and point A is labeled elastic behavior. Horizontal lines are drawn passing through points A and B intersecting the vertical axis at (0, 43,700) and (0, 59,000) respectively.

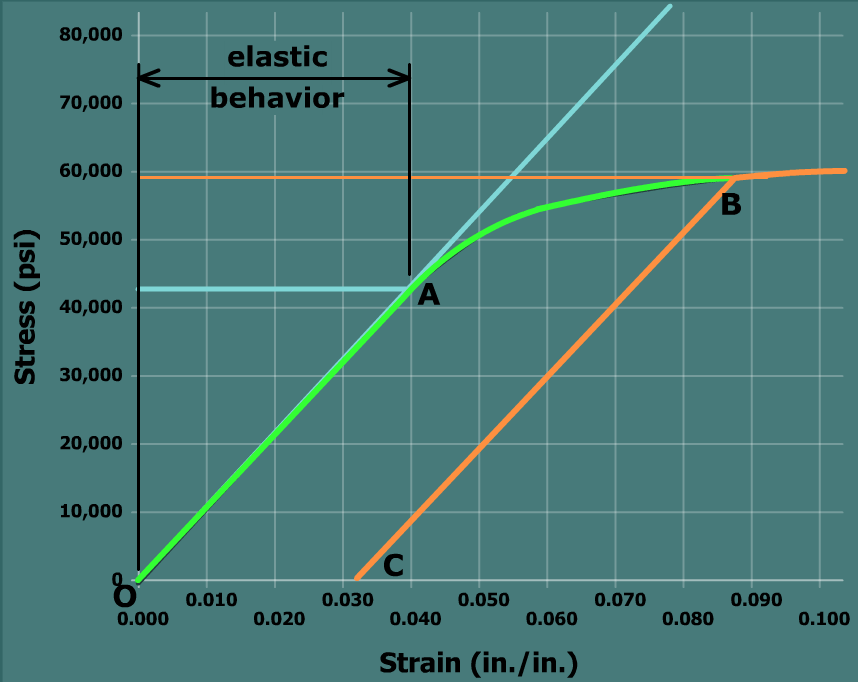
In general, a material acting on the linear portion of the stress-strain curve is said to exhibit elastic behavior. Strains produced in the material are temporary, meaning that all strain is recovered when the stress on the material is removed.