The graph plots stress in p s i versus strain in inch per inch. The horizontal axis ranges from 0 to 0.1 and the vertical axis ranges from 0 to 80,000. The graph starts at the bottom left of the viewing window at the origin, goes up and to the right with constant steepness till the point (0.050, 50,000). The graph then goes up and to the right with a reduced positive slope till (0.1, 60,000). A straight line is drawn passing through (0, 0) and (0.0040, 43,700) and it overlaps the linear portion of the curve. The portion of the curve between (0, 0) and (0.086, 59,000) is highlighted. Points A and B are marked on the curve at (0.04, 43,700) and (0.086, 59,000). Point C on the graph is at (0.033, 0) and a straight line is drawn joining the points B and C. The portion of the curve between the origin and point A is labeled elastic behavior and the portion of the curve between the points A and B is labeled plastic behavior. The interval from the origin O to the point C is on the horizontal axis is labeled plastic deformation.

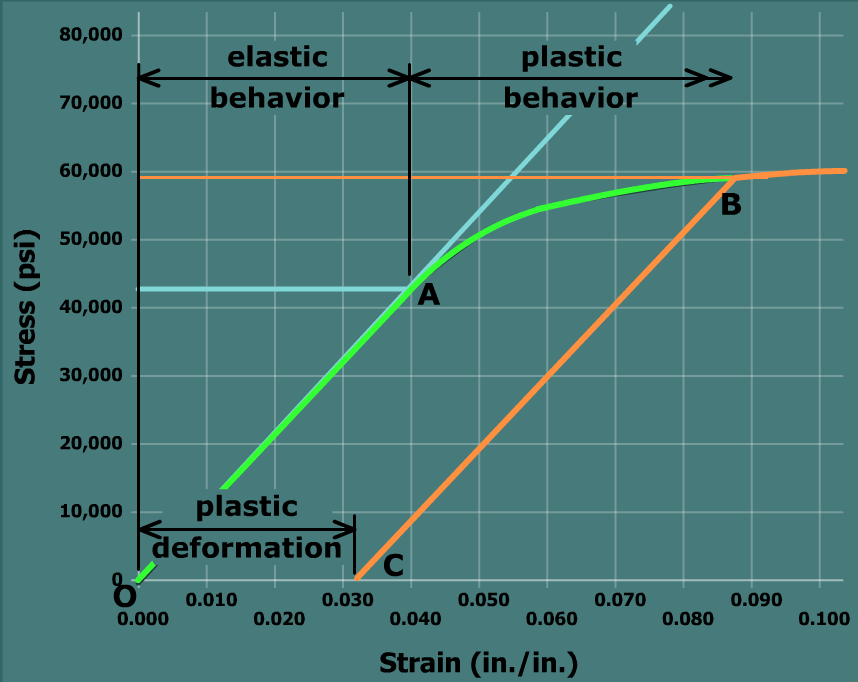
Beyond the elastic region, a material is said to exhibit plastic behavior. While some strain in the plastic region is temporary and can be recovered upon removal of the stress, a portion of the strain in the material is permanent. The permanent strain is termed plastic deformation.