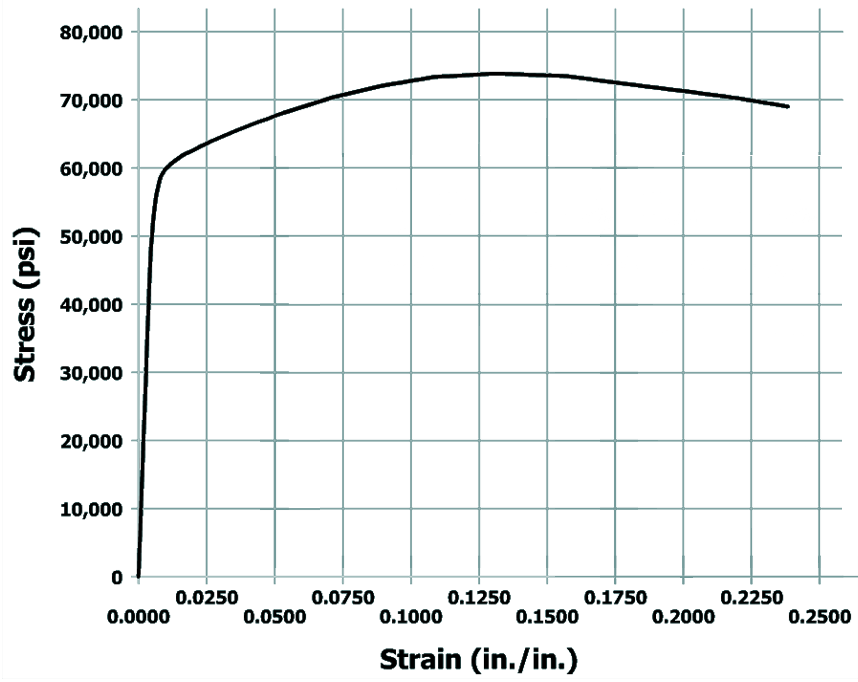
The graph plots stress in p s i versus the strain in inch per inch. The vertical axis ranges from 0 to 80,000 p s i and the horizontal axis ranges from 0 to 0.25. The graph starts from the bottom left of the viewing window at the origin, goes up and to the right with very high steepness till the point (0.01, 60,000). The graph then goes up and to the right with constant steepness till (0.125, 74,000). The graph then goes down and to the right with approximately constant steepness till (0.24, 68,000). All values estimated.

Other materials, such as the aluminum alloy shown here, do not have a clearly defined yield point. While the proportional limit marks the uppermost end of the linear portion of the stress-strain curve, it is sometimes difficult in practice to determine the proportional limit stress, particularly for materials with a gradual transition from a straight line to a curve.