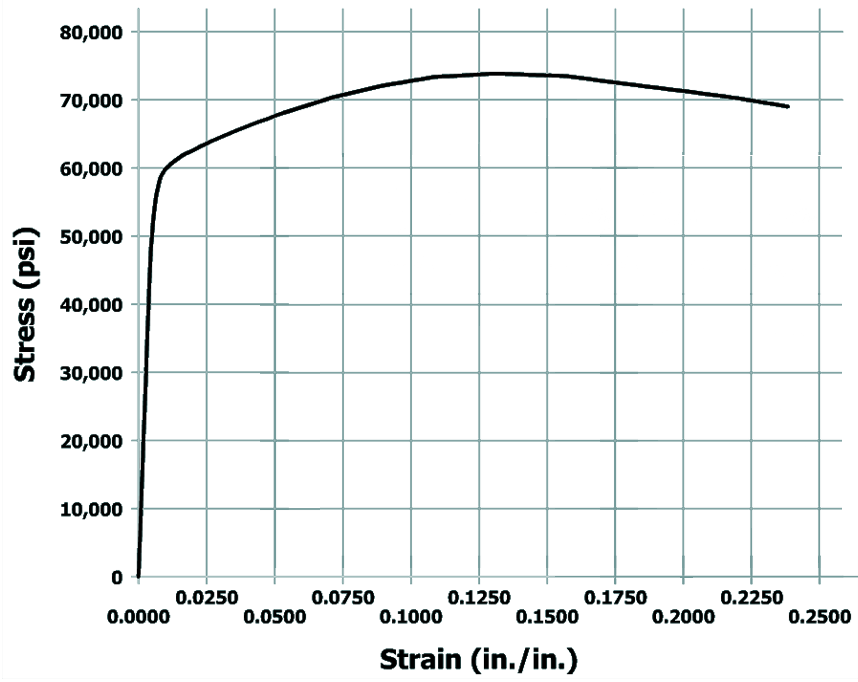
For materials such as this, a yield strength is defined. The yield strength is defined as the stress that will induce a specified permanent set in the material, usually or . (Note: a permanent set of is another way of expressing a strain value of )
For materials such as this, a yield strength is defined. The yield strength is defined as the stress that will induce a specified permanent set in the material, usually or . (Note: a permanent set of is another way of expressing a strain value of )