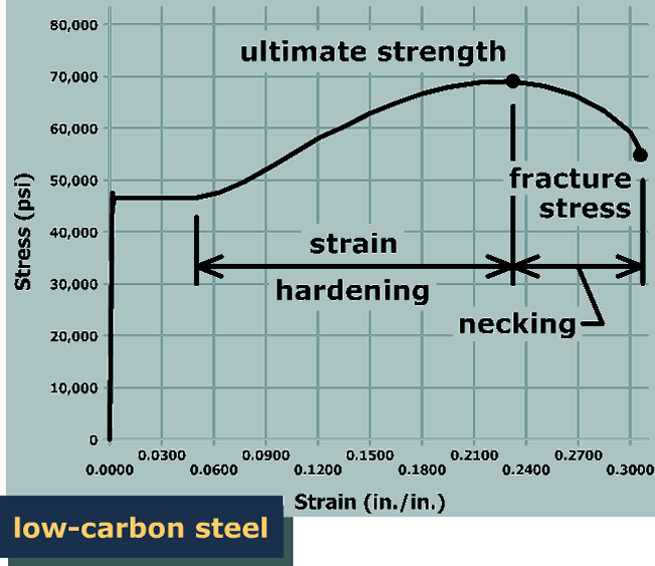
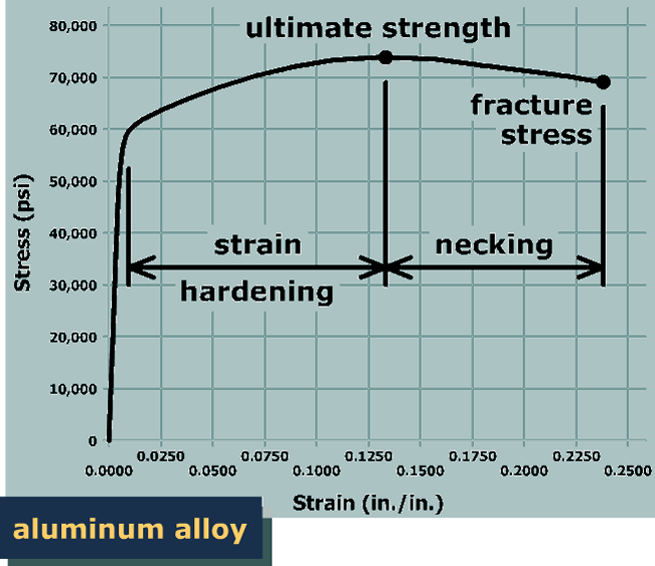
The stress at which the specimen breaks into two pieces is called the fracture stress.

Examine the relationship between the ultimate strength and the fracture stress. Doesn't it seem odd that the fracture stress is less than the ultimate strength? If the specimen didn't break at the ultimate strength, why would it break at a lower stress?

The graph plots stress in p s i versus strain in inch per inch for low carbon steel. The vertical axis ranges from 0 to 80,000 and the horizontal axis ranges from 0 to 0.3. The graph starts at the origin, shoots vertically up to the point (0, 47,000) on the vertical axis, goes horizontally to the right till (0.05, 47,000), goes up and to the right with approximately constant steepness till (0.21, 69,000), reaches at maximum at (0.23, 70,000) which is marked ultimate strength, goes down and to the right till (0.3, 60,000) and ends. The portion of the graph between the points (0.05, 47,000) and (0.23, 70,000) is labeled strain hardening. The portion of the graph between the points (0.23, 70,000) and (0.3, 60,000) is labeled necking and the stress corresponding to this portion is labeled fracture stress.
The graph plots stress in p s i versus the strain in inch per inch for aluminum alloy. The vertical axis ranges from 0 to 80,000 p s i and the horizontal axis ranges from 0 to 0.25. The graph starts from the bottom left of the viewing window at the origin, goes up and to the right with very high steepness till the point (0.01, 60,000). The graph then goes up and to the right with constant steepness till (0.13, 74,000) which is marked ultimate strength. The graph then goes down and to the right with approximately constant steepness till (0.24, 68,000) which is marked fracture stress and ends. The portion of the graph between (0.01, 60,000) and (0.13, 74,000) is labeled strain hardening and the portion of the graph between (0.13, 74,000) and (0.24, 68,000) is labeled necking.