The graph plots stress versus strain. Four curves are shown. The curve labeled A starts at the bottom left of the viewing window at the origin, goes up and to the right with constant steepness and exits the top left of the viewing window. The curve labeled B starts at the bottom left of the viewing window at the origin, goes up and to the right along curve A and then goes up and to the right with decreasing steepness and exits the top of the viewing window slightly to the right of curve A. The curve labeled C starts at the bottom left of the viewing window at the origin, goes up and to the right with constant steepness along curve A, goes up and to the right with decreasing steepness, reaches a maximum and then goes down and to the right with increasing steepness and exits the center of the viewing window. The curve labeled D starts at the bottom left of the viewing window at the origin, goes up and to the right with constant steepness, goes horizontally to the right, goes up and to the right with decreasing steepness, reaches a maximum and then goes down and to the right with increasing steepness and exits the right of the viewing window. Vertical dashed lines are drawn from the end points of the curves to the horizontal axis. The vertical dashed lines from left to right correspond to curves A, B, C and D. The slope of the linear portion of the curves is marked E.

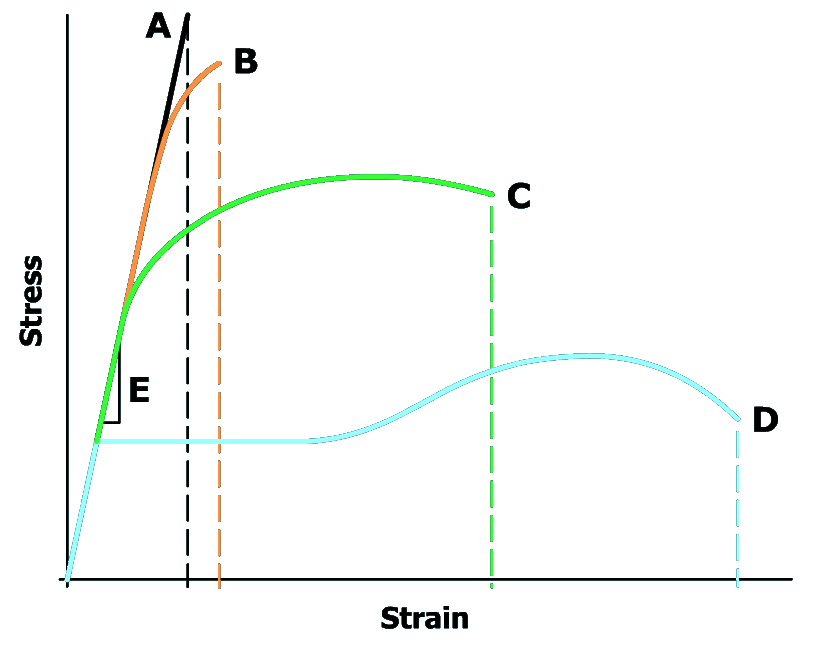
In fabricated structures and machine components, ductility also gives an indication of the material's ability to deform at holes, notches, fillets, grooves, and other discontinuities that cause stresses to intensify locally.

Plastic deformation in a ductile material allows stress to flow to a larger region around discontinuities. This redistribution of stress minimizes peak stress magnitudes and helps to prevent fracture in the component.