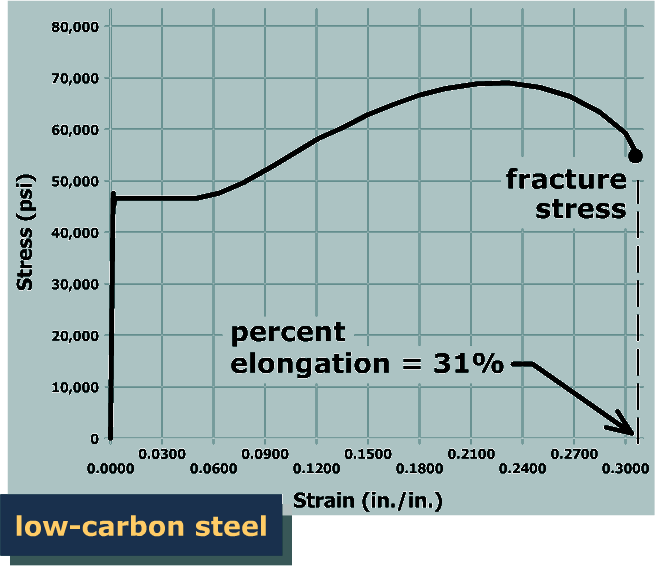
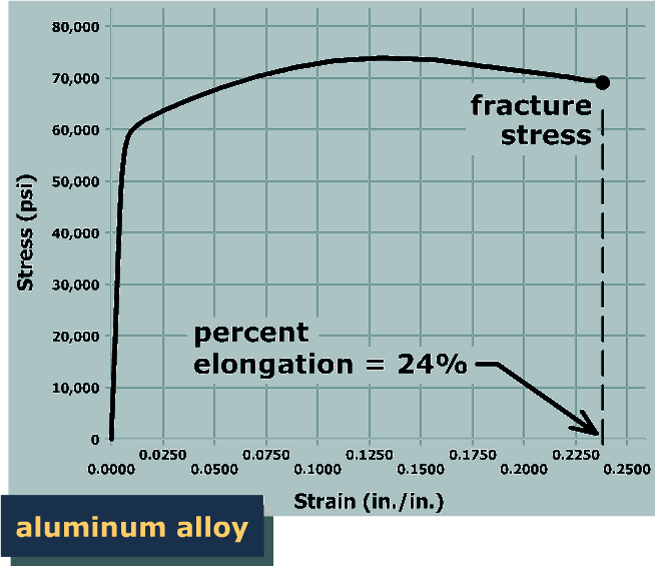
Two measures of ductility are obtained from the tension test. The first is the engineering strain at fracture. This value is usually expressed as a percentage and referred to as the percent elongation.

The graph plots stress in p s i versus the strain in inch per inch for aluminum alloy. The vertical axis ranges from 0 to 80,000 p s i and the horizontal axis ranges from 0 to 0.25. The graph starts from the bottom left of the viewing window at the origin, goes up and to the right with very high steepness till the point (0.01, 60,000). The graph then goes up and to the right with constant steepness till (0.13, 74,000) which is marked ultimate strength. The graph then goes down and to the right with approximately constant steepness till (0.24, 68,000) which is marked fracture stress and ends. The percent elongation corresponding to the fracture stress is 24 percent.
The graph plots stress in p s i versus strain in inch per inch for low carbon steel. The vertical axis ranges from 0 to 80,000 and the horizontal axis ranges from 0 to 0.3. The graph starts at the origin, shoots vertically up to the point (0, 47,000) on the vertical axis, goes horizontally to the right till (0.05, 47,000), goes up and to the right with approximately constant steepness till (0.21, 69,000), reaches at maximum at (0.23, 70,000), goes down and to the right till (0.3, 60,000) and ends. The stress at this end point is labeled fracture stress and the percent elongation corresponding to this value of stress is 31 percent.